Text-to-SQL with Knowledge Graph
Letting non-technical users query business data in plain English — grounded in a knowledge graph of business concepts, rules, and aliases, so the model reasons from definitions instead of guessing at column names.
By Jai Ganesh
What is text-to-SQL with a knowledge graph?
Text-to-SQL with a knowledge graph lets non-technical users query business data in plain English, with the LLM grounded in a curated graph of business concepts, metric definitions, rules, and approved join paths — not just raw schema. The model reasons from definitions ("high-risk means claims-to-premium above 0.5") instead of guessing at column names, which is the difference between a correct answer and a confidently wrong one. Generated SQL runs through a read-only security gate and is shown to the user for verification.
The Problem
Wire an LLM to your database schema and plain-English querying feels solved — until someone asks for "high-risk customers" and there is no risk column anywhere. The model starts guessing: maybe customers with many claims? A risk score that might exist? It hallucinates a WHERE clause against a column that isn't there, or worse, returns a confident answer built on the wrong definition.
The failure is structural: a schema is structurally complete and semantically empty. Table and column names carry none of the business meaning — what "active" means for a policy, which claims count as paid, how risk is actually calculated, what users call things versus what the DBA named them.
Text2SQL accuracy is not primarily a model problem — it is a context problem. The fix is a knowledge graph layered over the schema that makes business semantics queryable context, so the same model, asked the same question, reasons from definitions instead of guessing.
The Architecture
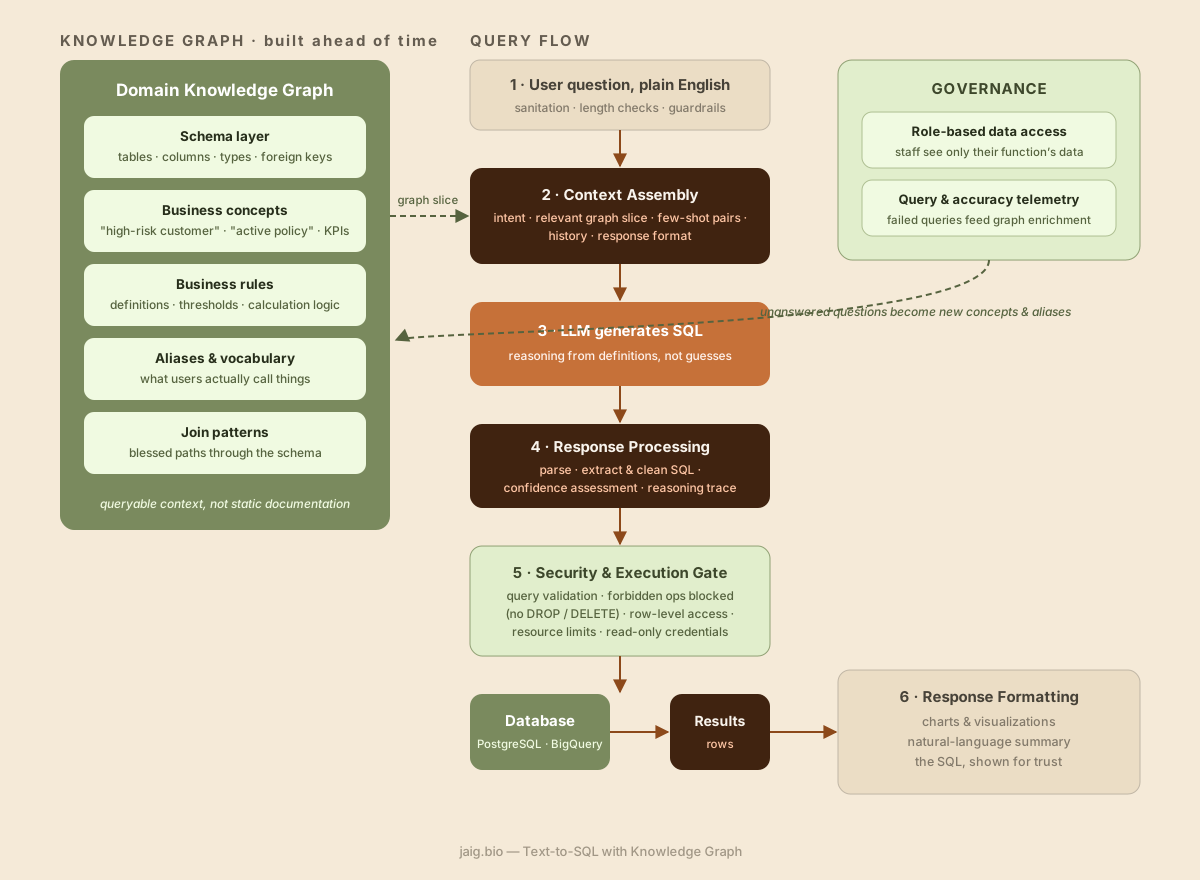
How It Works
The domain knowledge graph (built ahead of time)
Five layers over the raw schema: the schema itself (tables, columns, types, foreign keys); business concepts ("high-risk customer", "active policy", KPI definitions); business rules (thresholds and calculation logic — e.g., high-risk = total paid claims over 50% of total premiums, counting only active policies and approved claims); aliases mapping what users say to what the schema calls it; and blessed join patterns — the correct paths through the schema for common analyses.
Query capture and guardrails
The raw question passes input sanitation, length validation, and guardrails before anything else — hostile or malformed input dies at the door, not in the database.
Context assembly
The heart of the system. The user's intent selects the relevant slice of the knowledge graph — concepts, rules, aliases, and join patterns that bear on this question — assembled with few-shot question/SQL pairs, conversation history, and the expected response format. Most teams get every other stage right; this is where quality is won or lost.
SQL generation and response processing
The LLM generates SQL reasoning from provided definitions. The output is parsed and validated, the SQL extracted and cleaned, and the system records a confidence assessment and the model's reasoning trace — kept for display and debugging.
Security and execution gate
Before anything touches the database: query validation, forbidden-operation blocking (no DROP, no DELETE — the connection is read-only anyway), row-level access checks against the caller's role, and resource limits so a runaway query cannot take down the reporting replica.
Response formatting and the enrichment loop
Results return as charts, a natural-language summary, and the generated SQL shown for trust. Failed and unanswerable questions are telemetry: they surface missing concepts and aliases, which get added to the graph — the system's accuracy grows with use.
Design Decisions
A knowledge graph, not a longer prompt
Stuffing definitions into a static system prompt works until the domain outgrows the context window and every change needs a prompt review. A graph is queryable — each question retrieves only its relevant slice — and business analysts can maintain definitions without touching prompts.
Business rules encoded as data, not prose
Rule entries like "high-risk = claims/premiums > 0.5, active policies only, approved claims only" give the model calculation logic it can apply mechanically. Prose descriptions invite reinterpretation; structured rules get translated into the same SQL every time.
Read-only credentials plus operation blocking, not either alone
Defense in depth for generated SQL: the connection cannot write, and the validator rejects mutating statements anyway. When a model generates the query, you assume it will eventually generate something you did not expect.
Show the SQL alongside the answer
Analysts and finance folks will not trust a black box with numbers. Displaying the generated SQL (and the reasoning) lets skeptical users verify, converts them into correctors, and turns their corrections into graph improvements.
Blessed join patterns over free navigation
Most schemas have wrong-but-plausible joins that silently double-count. Curated join paths for common analyses remove the single largest source of confidently wrong answers.
Role-based data access enforced in the execution layer
Staff should only query data relevant to their function — enforced by the gate and the database's own row-level security, never by asking the model to be discreet.
Trade-offs & Limits
- ›The knowledge graph is an ongoing curation commitment — someone who knows the business must own definitions, or the graph drifts from reality and takes accuracy with it.
- ›Coverage is bounded by the graph: questions about concepts nobody encoded yet fall back to schema-only quality until the enrichment loop catches up.
- ›Complex analytical SQL (window functions, multi-CTE analyses) still exceeds reliable generation — some questions belong in a BI tool, and the system should say so.
- ›Latency is higher than a plain schema prompt: graph retrieval and validation add steps. Acceptable for analytics; noticeable for rapid-fire exploration.
When To Use It
- ✓Self-serve analytics for non-technical owners and operators over their own business data
- ✓Domains rich in business-specific definitions — insurance, healthcare, finance, logistics
- ✓Replacing the report-request backlog between business teams and data teams
- ✓As the analytical complement to a RAG assistant — documents to RAG, aggregates to SQL
When Not To
- ✕Questions answered from documents rather than structured data — that is RAG territory
- ✕Power users who already write SQL fluently — give them a console, not a chatbot
- ✕Schemas so clean and self-describing that plain schema context already performs — add the graph when definitions, not structure, cause the errors
Enterprise architect and independent AI consultant — I help teams take agentic systems from deck to production, with the governance story intact.